Command Line Examples
Welcome to the command-line guide for Scallops. This documentation walks you through the complete image processing and analysis pipeline, designed specifically for large-scale optical pooled screens (OPS).
The Scallops pipeline takes you from raw, uncorrected microscope image tiles to fully registered, segmented datasets, feature extraction, and downstream statistical analysis.
Note
A complete notebook tutorial with real data is also available to help you walk through this pipeline step-by-step on the periscope data.
Illumination Correction
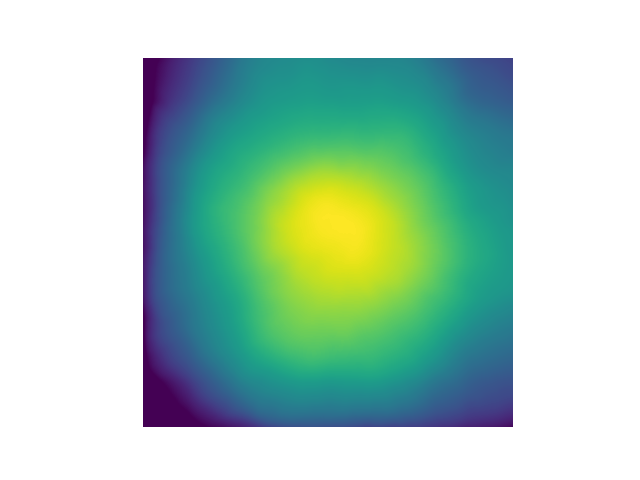
Illumination correction is computed separately for each well, cycle, and channel using all image tiles as input. It is calculated by computing the mean (or median; see –agg-method option), followed by a median filter (radius of the disk-shaped footprint is 1/20th area of image), and rescaling using 2nd percentile for a robust minimum in the aggregation method. This method is equivalent to CellProfiler’s CorrectIlluminationCalculate module with option “Regular”, “All”, “Median Filter”. The algorithm was originally benchmarked using ~250 images per plate to calculate plate-wise illumination correction functions (Singh et al. J Microscopy, 2014).
Example flat-field image:
Example:
# illumination correction per cycle in well 3 of ISS data
scallops illum-corr agg \
--agg-method mean \
--images "s3://xxx-input/" \
--image-pattern "20231010_10x_6W_SBS_c{t}/plate{plate}/Well{well}_Point{skip}_{skip}_Channel{skip}_Seq{skip}.nd2" \
--output "s3://xxx/stitch/iss/illumination_correction/" \
--groupby plate well t \
--subset "A-3-*"

# illumination correction per cycle in well 3 of IF & FISH data
scallops illum-corr agg \
--agg-method mean \
--images "s3://xxx-input/" \
--image-pattern "{skip}_20x_6W_{t}/plate{plate}/Well{well}_Point{skip}_{skip}_Channel{skip}_Seq{skip}.nd2" \
--output "s3://xxx/stitch/pheno/illumination_correction/" \
--groupby plate well t \
--subset "A-3-IF" "A-3-FISH"
Stitch
Each well and cycle is stitched independently into an OME Zarr image. The stage positions are read directly from a large number of file formats (including nd2). Illumination correction is applied by dividing the image intensity by the flatfield image when writing the stitched image.
Example:
scallops stitch \
--images "s3://xxx-input/"\
--image-pattern "20231010_10x_6W_SBS_c{t}/plate{plate}/Well{well}_Point{skip}_{skip}_Channel{skip}_Seq{skip}.nd2" \
--ffp "s3://xxx/stitch/iss/illumination_correction/{plate}-{well}-{t}.ome.tiff" \
--image-output "s3://xxx/stitch/iss/stitch/stitch.zarr" \
--report-output "s3://xxx/stitch/iss/stitch/report" \
--groupby plate well t \
--subset "A-3-*"

scallops stitch \
--images "s3://xxx-input/" \
--image-pattern "{skip}_20x_6W_{t}/plate{plate}/Well{well}_Point{skip}_{skip}_Channel{skip}_Seq{skip}.nd2" \
--ffp "s3://xxx/stitch/pheno/illumination_correction/{plate}-{well}-{t}.ome.tiff" \
--image-output "s3://xxx/stitch/pheno/stitch/stitch.zarr"  \
--report-output "s3://xxx/stitch/pheno/stitch/report"  \
--groupby plate well t \
--subset "A-3-IF" "A-3-FISH"
Register ISS Images
Register ISS images to first cycle.
Example:
scallops registration elastix \
--groupby plate well \
--moving-image-pattern '{plate}-{well}-{t}' \
--moving-output s3://xxx/ops/iss-registered-t0.zarr \
--moving s3://xxx/stitch/iss/stitch/stitch.zarr/ \
--transform-output s3://xxx/ops/iss-transforms-t0 \
--subset A-3
Register Phenotype Images
Create a single image stack registered to the IF DAPI channel. The unroll-channels option stacks all the phenotypic channels into the c dimension of the resulting image. The time option selects the reference round to align to. Note that the order of cycles is preserved (FISH, IF), hence the registered image has the FISH channels followed by the IF channels.
Example:
scallops registration elastix -\
-groupby plate well \
--moving-image-pattern '{plate}-{well}-{t}' \
--moving-output s3://xxx/ops/pheno-registered.zarr \
--moving s3://xxx/stitch/pheno/stitch/stitch.zarr/ \
--moving-label s3://xxx/stitch/pheno/stitch/stitch.zarr/ \
--transform-output s3://xxx/ops/pheno-to-pheno-transforms \
--subset A-3 \
--label-output s3://xxx/ops/pheno-registered.zarr \
--unroll-channels \
--time IF
Segmentation
Segment the phenotype images. Note that there is a one-to-one correspondence between nuclei and cell labels when using the watershed or propagation algorithms for cell segmentation. Cytosol labels are computed by taking the difference between cell and nuclei labels.
Nuclei:
scallops segment nuclei \
--images s3://xxx/ops/pheno-registered.zarr \
--groupby plate well \
--image-pattern '{plate}-{well}' \
--dapi-channel 4 \
--output s3://xxx/ops/segment.zarr \
--subset A-3
Cells:
scallops segment cell \
--images s3://xxx/ops/pheno-registered.zarr \
--groupby plate well \
--image-pattern '{plate}-{well}' \
--cyto-channel 6 \
--nuclei-label s3://xxx/ops/segment.zarr \
--output s3://xxx/ops/segment.zarr \
--subset A-3
Register Phenotype to ISS & Transfer Segmentation Labels
Register the phenotype image to the ISS image and transfer the segmentation labels from phenotype image coordinates to ISS coordinates. Also output the registered phenotype DAPI channel, which will be used later for QC.
Example:
scallops registration elastix \
--groupby plate well \
--moving-image-pattern '{plate}-{well}' \
--moving-output s3://xxx/ops/pheno-to-iss-registered.zarr \
--moving s3://xxx/ops/pheno-registered.zarr \
--moving-label s3://xxx/ops/segment.zarr \
--fixed s3://xxx/stitch/iss/stitch/stitch.zarr/ \
--fixed-image-pattern '{plate}-{well}-{t}' \
--transform-output s3://xxx/ops/pheno-to-iss-transforms \
--subset A-3 \
--label-output s3://xxx/ops/pheno-to-iss-registered.zarr \
--output-aligned-channels-only
Spot Detection
Find spots by taking standard deviation over cycles, followed by mean across channels or if only 1 cycle is present, computing standard deviation across channels.
Example:
scallops pooled-sbs spot-detect \
--output s3://xxx/ops/spot-detect.zarr \
--image-pattern '{plate}-{well}' \
--images s3://xxx/ops/iss-registered-t0.zarr \
--channel 1 2 3 4 \
--groupby plate well \
--subset A-3
Read calling
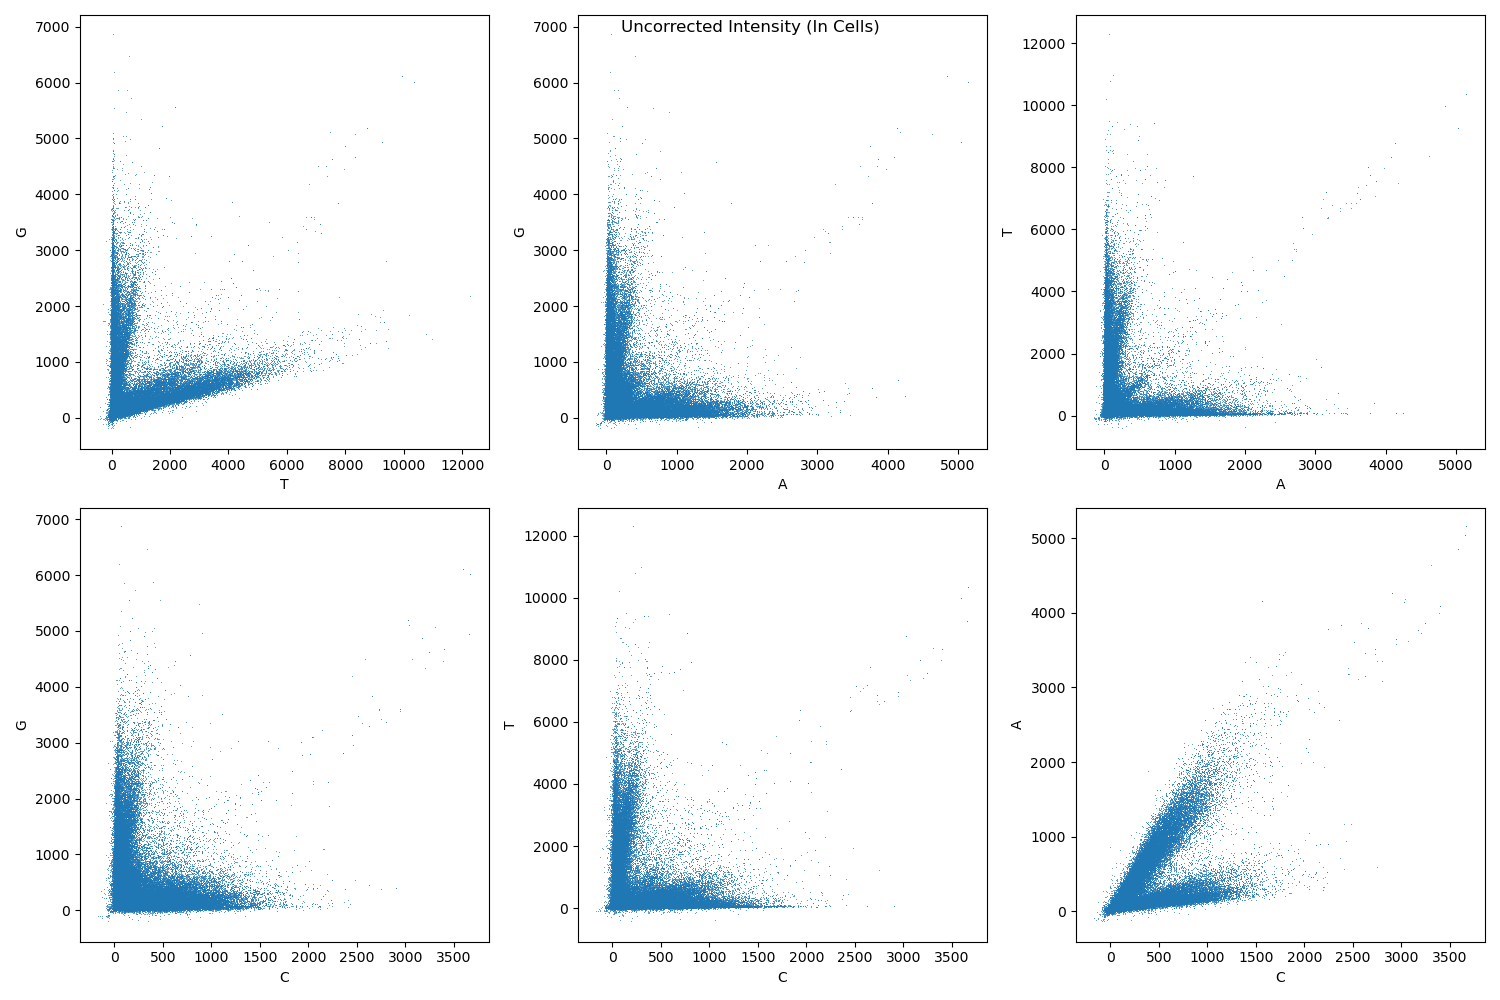
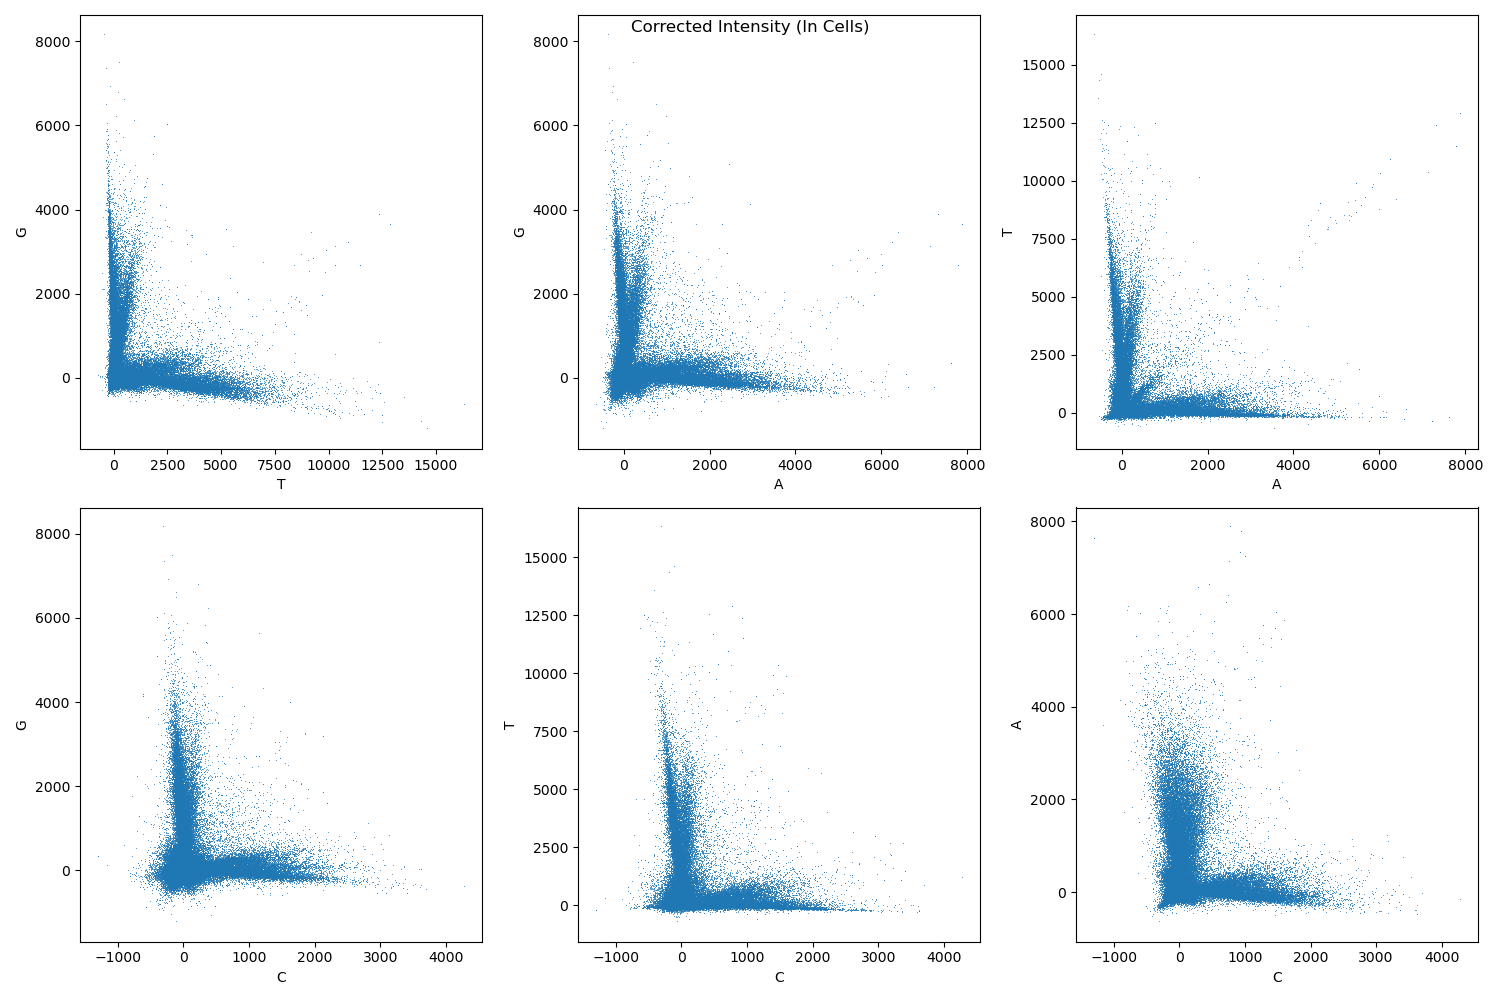
Assign bases at each cycle to the base with maximum intensity after correcting for channel crosstalk.
Example crosstalk before correction:
Example crosstalk after correction:
Example:
scallops pooled-sbs reads \
--spots s3://xxx/ops/spot-detect.zarr \
--labels s3://xxx/ops/pheno-to-iss-registered.zarr \
--label-name cell \
--output s3://xxx/ops/reads \
--subset A-3 \
--barcodes s3://xxx/barcodes/dialout-5.csv
Find objects
Find objects in a labeled array (output from segmentation).
Nuclei:
scallops find-objects \
--labels s3://xxx/ops/segment.zarr \
--subset A-3 \
--label-pattern {plate}-{well} \
--label-suffix nuclei \
--output s3://xxx/ops/objects-nuclei
Cells:
scallops find-objects \
--labels s3://xxx/ops/segment.zarr \
--subset A-3 \
--label-pattern {plate}-{well} \
--label-suffix cell \
--output s3://xxx/ops/objects-cell\
Cytosol:
scallops find-objects \
--labels s3://xxx/ops/segment.zarr \
--subset A-3 \
--label-pattern {plate}-{well} \
--label-suffix cytosol \
--output s3://xxx/ops/objects-cytosol
Features
Compute phenotype features.
Nuclei:
scallops features \
--features-nuclei intensity_* \
--labels s3://xxx/ops/segment.zarr \
--groupby plate well \
--subset A-3 \
--output s3://xxx/ops/features-nuclei \
--images s3://xxx/ops/pheno-registered.zarr \
--objects s3://xxx/ops/objects-nuclei \
--image-pattern '{plate}-{well}'
Cells:
scallops features \
--features-cell intensity_* \
--labels s3://xxx/ops/segment.zarr \
--groupby plate well \
--subset A-3 \
--output s3://xxx/ops/features-cell \
--images s3://xxx/ops/pheno-registered.zarr \
--objects s3://xxx/ops/objects-cell \
--image-pattern '{plate}-{well}'
Cytosol:
scallops features \
--features-cytosol intensity_* \
--labels s3://xxx/ops/segment.zarr \
--groupby plate well \
--subset A-3 \
--output s3://xxx/ops/features-cytosol \
--images s3://xxx/ops/pheno-registered.zarr \
--objects s3://xxx/ops/objects-cytosol \
--image-pattern '{plate}-{well}'
Mark Cells That Intersect Stitching Boundary
IF (Reference Phenotype used for registration):
scallops features \
--features-cell intersects-boundary_0 \
--labels s3://xxx/ops/segment.zarr \
--groupby plate well \
--subset A-3 \
--output s3://xxx/ops/intersects-boundary \
--images s3://xxx/stitch/pheno/stitch/stitch.zarr/labels/ \
--objects s3://xxx/ops/objects-cell \
--image-pattern '{plate}-{well}-IF-mask'
FISH:
scallops features \
--features-cell intersects-boundary_0 \
--labels s3://xxx/ops/segment.zarr \
--groupby plate well \
--subset A-3 \
--output s3://xxx/ops/intersects-boundary-t \
--images s3://xxx/ops/pheno-registered.zarr/labels/ \
--objects s3://xxx/ops/objects-cell \
--image-pattern '{plate}-{well}-{t}-mask'
Registration QC
Find objects in ISS image:
scallops find-objects \
--labels s3://xxx/ops/pheno-to-iss-registered.zarr \
--subset A-3 \
--label-pattern {plate}-{well} \
--label-suffix nuclei \
--output s3://xxx/ops/objects-nuclei-iss
Compute correlation in nuclei bounding boxes between ISS DAPI channel and registered IF DAPI channel:
scallops features \
--features-nuclei correlationpearsonbox_0_s0 \
--labels s3://xxx/ops/pheno-to-iss-registered.zarr \
--objects s3://xxx/ops/objects-nuclei-iss \
--groupby plate well \
--subset A-3 \
--output s3://xxx/ops/pheno-to-iss-qc \
--images s3://xxx/ops/iss-registered-t0.zarr \
--stack-images s3://xxx/ops/pheno-to-iss-registered.zarr \
--image-pattern '{plate}-{well}' \
--stack-image-pattern '{plate}-{well}' \
--channel-rename '{"0":"ISS","s0":"PHENO"}'
Compute correlation in nuclei bounding boxes between ISS DAPI channel at t=0 and other times:
scallops features \
--features-nuclei correlationpearsonbox_0_0:35:5 \
--labels s3://xxx/ops/pheno-to-iss-registered.zarr \
--objects s3://xxx/ops/objects-nuclei-iss \
--groupby plate well \
--subset A-3 \
--output s3://xxx/ops/iss-to-iss-qc \
--images s3://xxx/ops/iss-registered-t0.zarr \
--image-pattern '{plate}-{well}'
Compute correlation in nuclei bounding boxes between IF DAPI channel and FISH DAPI channel:
scallops features \
--features-nuclei correlationpearsonbox_0_4 \
--labels s3://xxx/ops/segment.zarr \
--objects s3://xxx/ops/objects-nuclei \
--groupby plate well \
--subset A-3 \
--output s3://xxx/ops/pheno-to-pheno-qc \
--images s3://xxx/ops/pheno-registered.zarr \
--image-pattern '{plate}-{well}' \
--channel-rename '{"0":"FISH","4":"IF"}'
Merge
Merge the phenotype features, ISS barcode assignments, and QC info.
Example:
scallops pooled-sbs merge \
--sbs s3://xxx/ops/reads/labels \
--output s3://xxx/ops/merge \
--barcodes s3://bigdipir-ctg-s3/internal/singa166-lab/barcodes/dialout-5.csv \
--phenotype s3://xxx/ops/objects-nuclei \
s3://xxx/ops/objects-cell \
s3://xxx/ops/objects-cytosol \
s3://xxx/ops/features-nuclei \
s3://xxx/ops/features-cell \
s3://xxx/ops/features-cytosol \
s3://xxx/ops/intersects-boundary \
s3://xxx/ops/intersects-boundary-t \
s3://xxx/ops/pheno-to-iss-qc \
s3://xxx/ops/iss-to-iss-qc \
s3://xxx/ops/pheno-to-pheno-qc \
--subset A-3
Rank Features
Example:
scallops rank-features \
--input s3://xxx/ops/merge/A-3.parquet \
--reference "NTC" \
--features Nuclei_Intensity_MedianIntensity_Channel5 \
--label-filter "barcode_Q_mean_0/barcode_Q_mean==1 & \
Nuclei_Correlation_PearsonBox_ISS_PHENO>0.9 & \
Nuclei_Correlation_PearsonBox_FISH_IF>0.9 & \
~Cells_Location_IntersectsBoundary_Channel0==False & \
~Cells_Location_IntersectsBoundary_Channel0_intersects_boundary_t==False" \
--output s3://xxx/ops/rank-features/A-3.parquet
Volcano Plot:
import pandas as pd
from adjustText import adjust_text
from matplotlib import pyplot as plt
import seaborn as sns
import numpy as np

rank_features_df = pd.read_parquet('s3://xxx/ops/rank-features/A-3.parquet')
feature = 'Nuclei_Intensity_MedianIntensity_Channel5'
fig, ax = plt.subplots()
ax.set_title(feature)
df = rank_features_df.query(f"feature=='{feature}'")
df["-log10FDR"] = np.minimum(10, -np.log10(df["FDR"]))
highlight_df = df.query("abs(fold_change)>2 & FDR<0.05")
sns.scatterplot(df, x="fold_change", y="-log10FDR", ax=ax)
texts = [
    ax.text(
        x=r["fold_change"],
        y=r["-log10FDR"],
        s=r["perturbation"],
    )
    for i, r in highlight_df.iterrows()
]
adjust_text(
    texts,
    arrowprops=dict(arrowstyle="->", color="Grey"),
    ax=ax,
    x=highlight_df["fold_change"],
    y=highlight_df["-log10FDR"],
    expand_axes=True
);